File list
From Climate State Wiki
This special page shows all uploaded files.
| Date | Name | Thumbnail | Size | User | Description | Versions |
|---|---|---|---|---|---|---|
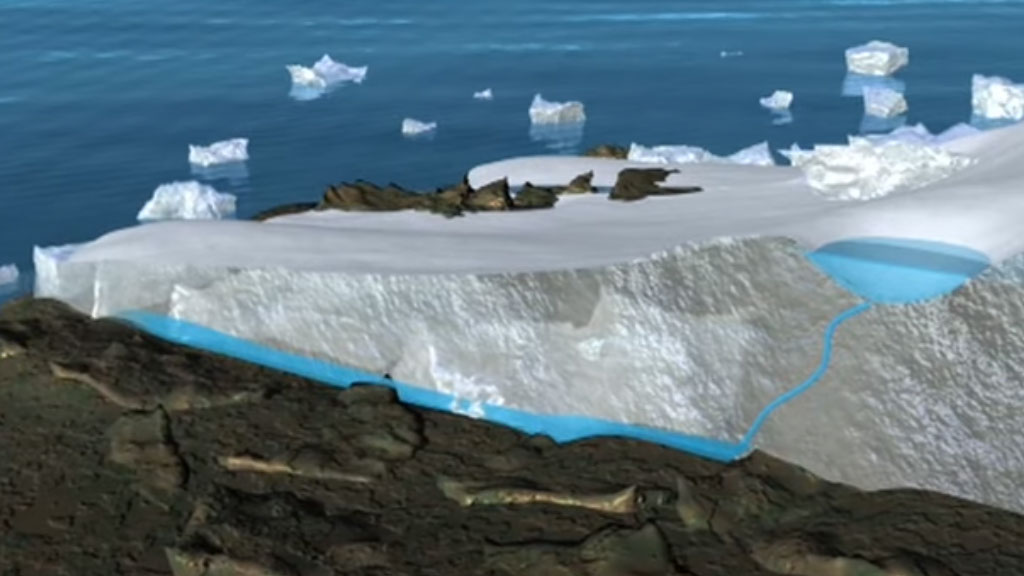
| 10:58, 22 May 2023 | Greenland-2014-Follow-the-Water-Moulin.jpg (file) |  |
72 KB | Chris | Illustration of a moulin channel. | 1 |
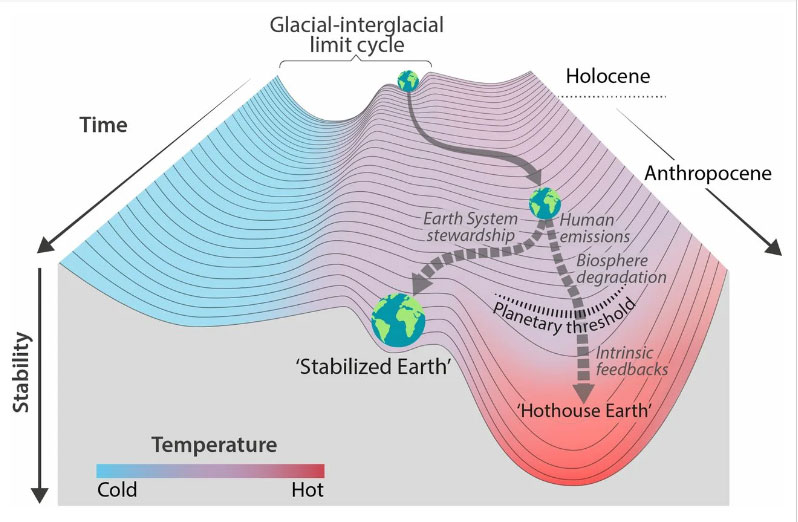
| 10:25, 12 May 2023 | Trajectories-of-the-Earth-System-Anthropocene-Pathway-of-Earth-System-Holocene.jpg (file) |  |
78 KB | Chris | Stability landscape showing the pathway of the Earth System out of the Holocene and thus, out of the glacial–interglacial limit cycle to its present position in the hotter Anthropocene. The fork in the road in Fig. 1 is shown here as the two divergent pathways of the Earth System in the future (broken arrows). Currently, the Earth System is on a Hothouse Earth pathway driven by human emissions of greenhouse gases and biosphere degradation toward a planetary threshold at ∼2 °C (horizontal brok... | 1 |
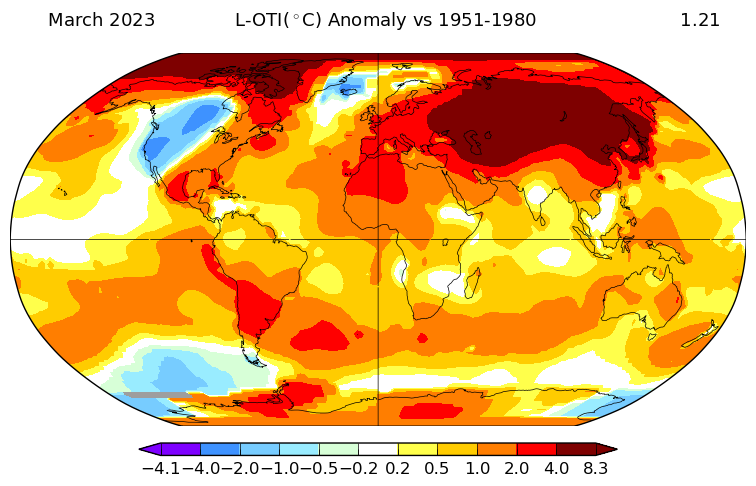
| 20:09, 4 May 2023 | NASA GISS Surface Temperature Analysis March 2023.png (file) |  |
92 KB | Chris | Source https://data.giss.nasa.gov/gistemp/maps/index_v4.html | 1 |
| 18:33, 4 May 2023 | Sea-Level-Rise-1900-2018 NASA.jpg (file) |  |
45 KB | Chris | Data source: Frederikse et al. (2020) Credit: NASA’s Goddard Space Flight Center/PO.DAAC Source https://climate.nasa.gov/vital-signs/sea-level/ | 1 |
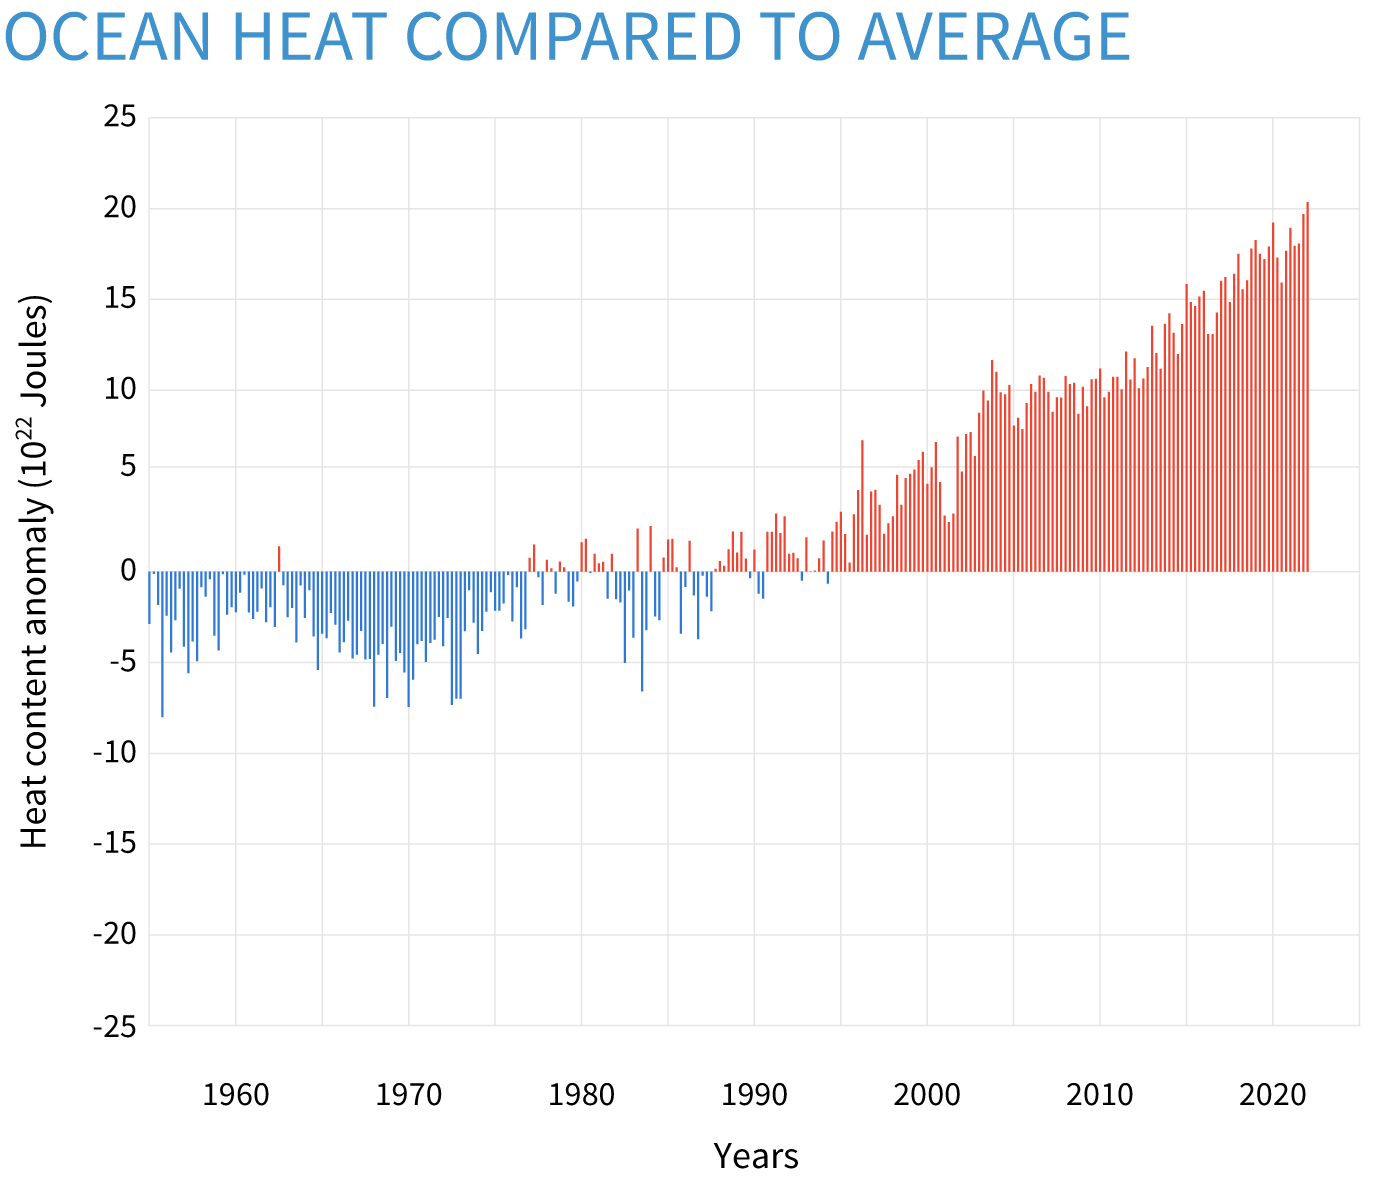
| 12:25, 4 May 2023 | ClimateDashboard-ocean-heat-content-graph-20220825-1400px.jpg (file) |  |
261 KB | Chris | Seasonal (3-month) heat energy in the top half-mile of the ocean compared to the 1955-2006 average. Heat content in the global ocean has been consistently above-average (red bars) since the mid-1990s. More than 90 percent of the excess heat trapped in... | 1 |
| 10:47, 4 May 2023 | Wiki Ocean depth.jpg (file) |  |
16 KB | Chris | Source https://unsplash.com/photos/iBY2XCgPwDA | 1 |