File:ClimateDashboard-ocean-heat-content-graph-20220825-1400px.jpg
Original file (1,400 × 1,200 pixels, file size: 261 KB, MIME type: image/jpeg)
Summary
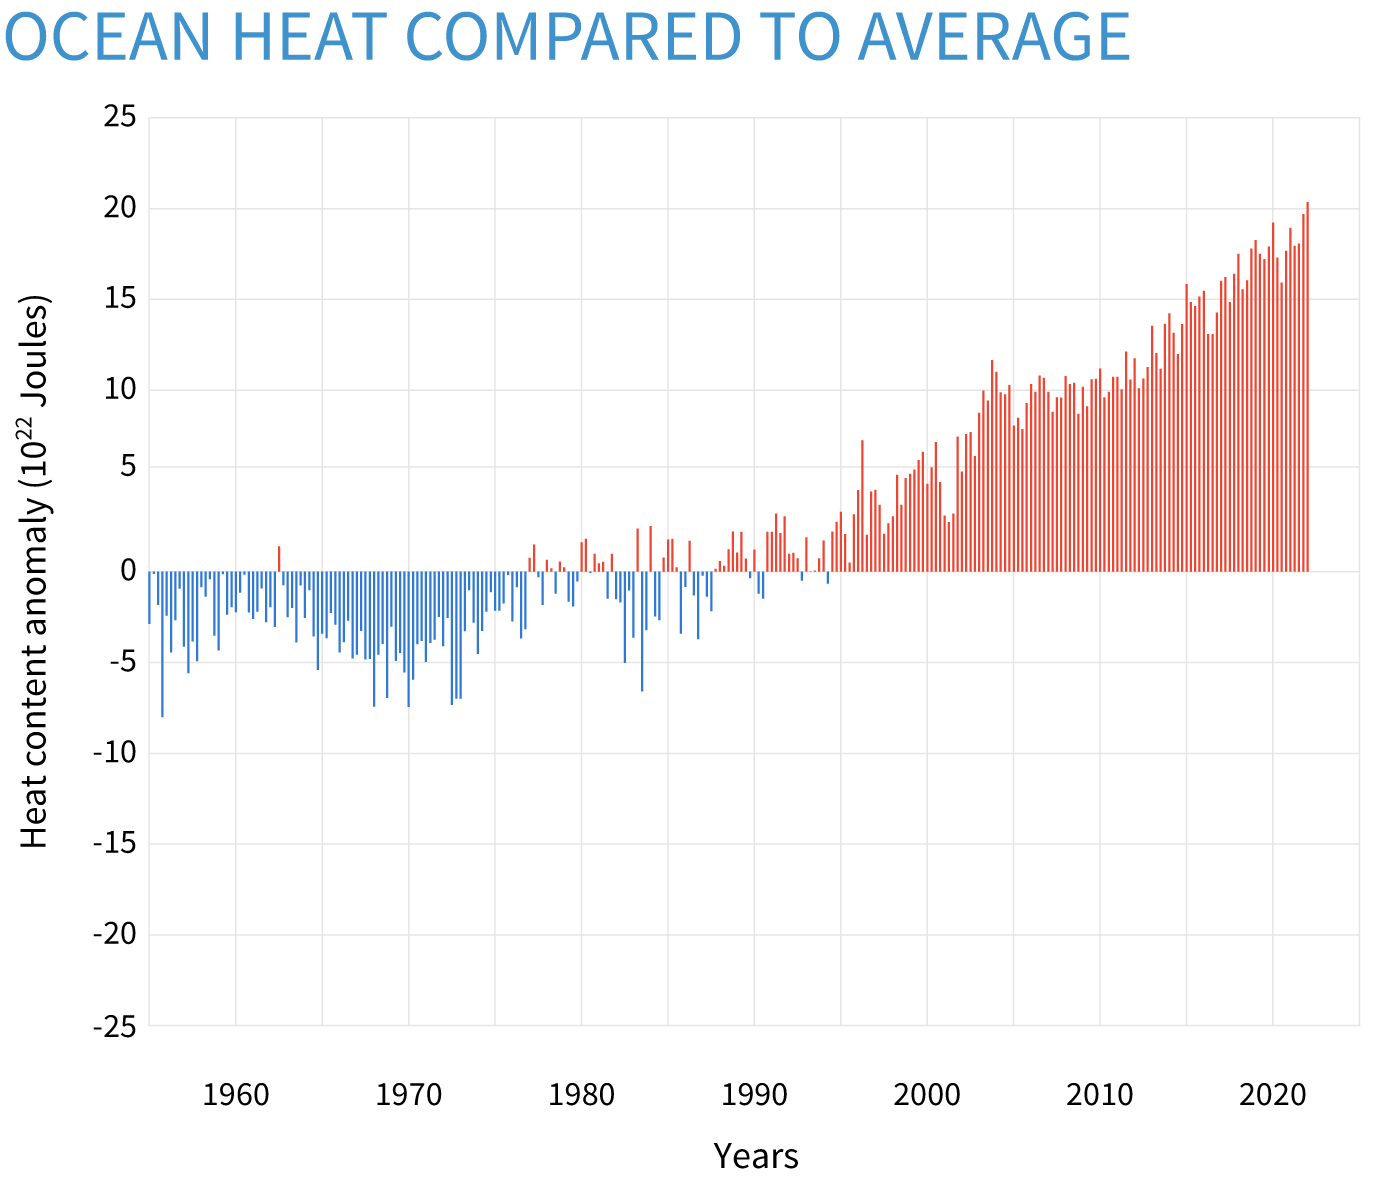
Seasonal (3-month) heat energy in the top half-mile of the ocean compared to the 1955-2006 average. Heat content in the global ocean has been consistently above-average (red bars) since the mid-1990s. More than 90 percent of the excess heat trapped in the Earth system due to human-caused global warming has been absorbed by the oceans. NOAA Climate.gov graph, based on data (0-700m) from the NCEI Ocean Heat Content product collection.
Licensing
The 'Creative Commons Zero' (CC0) license includes content published into the Public Domain, with no copyright.
File history
Click on a date/time to view the file as it appeared at that time.
| Date/Time | Thumbnail | Dimensions | User | Comment | |
|---|---|---|---|---|---|
| current | 12:25, 4 May 2023 | | 1,400 × 1,200 (261 KB) | Chris (talk | contribs) | Seasonal (3-month) heat energy in the top half-mile of the ocean compared to the 1955-2006 average. Heat content in the global ocean has been consistently above-average (red bars) since the mid-1990s. More than 90 percent of the excess heat trapped in... |
You cannot overwrite this file.
File usage
The following page uses this file: