Sea level rise: Difference between revisions
From Climate State Wiki
(Created page with "thumb|320px|NASA’s Goddard Space Flight Center/PO.DAAC Between 1901 and 2018, the average global sea level rose by 15–25 cm (6...") |
No edit summary |
||
| Line 1: | Line 1: | ||
[[File:Sea-Level-Rise-1900-2018 NASA.jpg|thumb|320px|NASA’s Goddard Space Flight Center/PO.DAAC]] | [[File:Sea-Level-Rise-1900-2018 NASA.jpg|thumb|320px|NASA’s Goddard Space Flight Center/PO.DAAC]] | ||
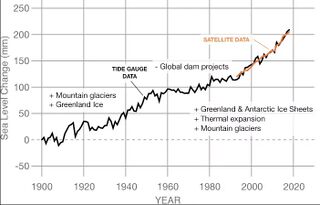
Between 1901 and 2018, the average global sea level rose by 15–25 cm (6–10 in), or 1–2 mm per year.<ref>IPCC Report (2019) [https://www.ipcc.ch/srocc/ Summary for Policymakers]</ref> | Between 1901 and 2018, the average global sea level rose by 15–25 cm (6–10 in), or 1–2 mm per year.<ref>IPCC Report (2019) [https://www.ipcc.ch/srocc/ Summary for Policymakers]</ref> This rate is increasing; sea levels are now rising at a rate of 3.7 mm (0.146 inches) per year.<ref>IPCC Report (2021) [https://www.ipcc.ch/report/ar6/wg1/ Climate Change 2021: The Physical Science Basis]</ref> | ||
==References== | ==References== | ||
Revision as of 17:35, 4 May 2023
Between 1901 and 2018, the average global sea level rose by 15–25 cm (6–10 in), or 1–2 mm per year.[1] This rate is increasing; sea levels are now rising at a rate of 3.7 mm (0.146 inches) per year.[2]
References
- ↑ IPCC Report (2019) Summary for Policymakers
- ↑ IPCC Report (2021) Climate Change 2021: The Physical Science Basis
